

Traders and investors use several approaches to find buying and selling opportunities. Some use technical analysis while others focus on fundamental, sentimental, and price action analysis.
Among the most successful traders, many of them use a holistic approach, where they combine all these strategies. This article will focus on an approach known as mean reversion, which is a common one among day traders and investors.
Table of Contents
What is mean reversion?
Mean reversion is a theory in finance that suggests that an asset price will always return to its historic average over time. This means that an asset that spikes suddenly will pull back in order to retest its historic range over time.
Some traders and investors strongly believe in the mean reversion approach while others believe it does not work. Further, mean reversion has some bias baked in it such as the gambler’s bias, which suggests that an asset will move in a certain way based on past events.
Traders use several approaches when using the mean reversion theory. Some use technical indicators like moving averages, Parabolic SAR, and Bollinger Bands. Other traders use trading channels, regression channels, and even visuals to determine this.
Mean reversion and regression
One way of using mean reversion is to use regression. The most common regression approach is known as the Raff regression channel, which is based on linear regression. This channel is drawn by connecting several levels of support or resistance.
As a result, it will have three lines whose width is dependent on the high and low levels. A good example of this regression channel is shown below.
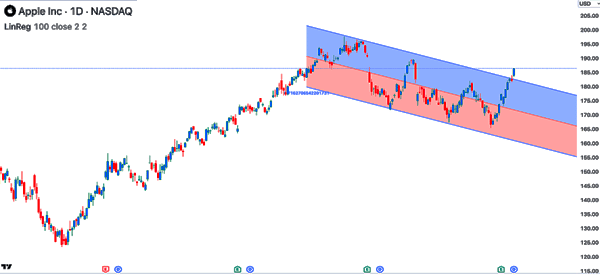
As you can see, Apple’s shares have been in a downtrend. In this period, the price is oscillating between the middle line of the regression channel.
In this case, the mean reversion approach suggests that the price will gravitate towards the mean price of the chart. However, as the chart shows, at times, the price might deviate from this mean, for several reasons.
For example, if an M&A deal occurs in a company, the company being acquired will often have a bullish breakout and not return to the range again. This happens because the stock will often jump to match the acquisition price.
Mean reversion vs trend following
By now, you have a good understanding of what mean reversion is. It simply means that a financial asset will often revert to its normal range over time.
Trend following, on the other hand, is a theory that suggests that an asset in an uptrend will continue in that direction over time. Similarly, it suggests that an asset that is in a downtrend will maintain that trend over time.
Trend following is an approach that has worked well over time, especially for investors in American stocks. While key indices like the S&P 500 and Nasdaq 100 index retreats in some periods, their overall trend is usually bullish.
Traders use the concept of mean reversion in trend-following. For example, they use the approach to find pullbacks, which they can use to buy the dip.
Mean reversion and technical indicators
One of the best approaches for using the mean reversion approach is to use technical indicators. Indicators like:
- Moving averages
- Bollinger Bands
- Relative Strength Index (RSI)
- Stochastic Oscillator
are some of the top indicators you can use with the mean reversion approach.
A moving average is an indicator that looks at an asset’s mean price over time. For example, the 50-day Simple Moving Average (SMA) will look at an asset’s price in the 50-day period.
If an asset is substantially above the average, it can be said to be away from its historic average. As such, a trader using this approach will often short the stock, hoping that it will pull back.
There are several types of moving averages. They are all based on the same concept but use a different calculation approach. For example, while the Simple Moving Average (SMA) looks at all periods equally, the Exponential MA puts more weight on the recent prices.
The other popular mean reversion indicator to use is known as the Bollinger Bands. This indicator is based on the concept of moving average and standard deviation. The middle line is the moving average and the two outer ones are its standard deviations.
The Relative Strength Index (RSI) and the Stochastic Oscillators are used to find overbought and oversold levels in the market. The theory is that an asset that reaches these extreme levels will often move back to the normal price.
Mean reversion calculation and formula
The calculation of mean reversion is quite complex and is outside the purview of this article. As an ordinary day trader, you are not required to know all this.
The first step of calculating mean reversion is to get an asset’s historical data for a certain period. This period could be a month, years, or weeks. Many chart platforms provide this raw data.
The second stage is to use this data and apply the following formula.
(Current price – Mean price) / Standard deviation = Z-score
In this case, the Z score measures how the standard deviations of an asset price is away from the mean. For example, if the asset’s price is currently $70 and the mean is $50 and the standard deviation is $5, you can find the mean reversion as shown below:
Z-score = (70-50) / 5 = 4
Mean reversion strategies
There are several mean reversion strategies that you can use in day trading, including:
Regression channels
One of the easiest mean reversion strategies is known as regression channels. As mentioned above, a channel is a tool that connects several support and resistance points. Therefore, after drawing a regression channel, you can buy when the price moves to the lower side and exit when it moves to the middle line.
Similarly, you can place a short trade when it retests the upper side of the channel and exit when it moves to the mean level. You can use the channel in a long-term chart or a short-term one.

Using moving averages
Moving averages are the best technical indicators to use in day trading. As mentioned, these averages look at an asset’s price over time.
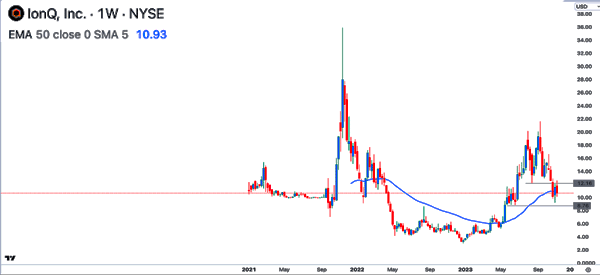
In this case, you should select a certain moving average level and see how it is performing in a chart. If it deviates deeply from the MA, it is a sign that it will move back to the normal level.
A good example of this approach is in the chart below. As shown, the IONQ stock price was in a strong bullish trend in 2023 as the concept of artificial intelligence was gaining steam. This rally pushed it higher than the 50-week moving average. It then retreated and moved back to the average price over time.
Support and resistance levels
The other approach for trading the mean reversion approach is to use support and resistance lines. A support line is one that connects several low points of an asset while the resistance connects several high points.
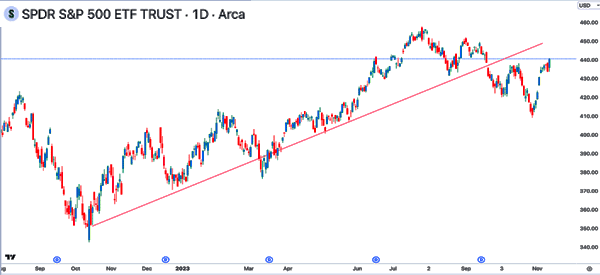
In the chart below, we see that the SPY ETF is in an overall bullish trend. As it rises, it remains above the ascending trendline shown in red. In this case, the mean reversion approach suggests that the price will often pull back and retest this support level.
Is mean reversion different in day trading vs investing?
The concept of mean reversion is widely used in both day trading and investing. For starters, day trading is a trading approach where a person buys and sells financial assets within a day. Swing traders hold their positions for a few days while investors hold them for a few months or years.
Therefore, the concept of mean reversion is the same across these trading approaches but it is implemented differently.
For example, a day trader will often use a one-minute to a 15-minute chart while an investor will use the daily chart. As such, the day trader will use shorter moving averages while the investor will use longer timeframes.
Benefits of mean reversion
There are several benefits of using the mean reversion approach, including:
- It works well in trend-following and also reversals.
- It is an easy approach to use when trading and investing.
- It can be used in different ways, including technical indicators and chart patterns.
- It is easy to do risk management with the strategy.
- It is an approach with strong profit potential.
Drawbacks of Mean Reversion
- An asset might continue rising for a long time and not move back to the mean reversion.
- It does not work in several market conditions such as when they are extremely volatile.
- It can give false signals even when applied well.
FAQs
Is mean reversion reliable?
Mean reversion is often a reliable trading approach. However, like other trading approaches, it also has some of its drawbacks as we have described above. This calls for the intentional use of risk management strategies.
Which is the best asset for mean reversion?
Mean reversion can be used across all financial assets including stocks, forex, commodities, and cryptocurrencies. However, in most cases, the approach works better in the stock market.
What is the best moving average to use?
This is a commonly asked question. Unfortunately, there is no right answer to this question. If you decide to use the approach, we recommend that you test several moving average periods as you develop your strategy.
External useful resources
- 3 Best Mean Reversion Trading Strategies – Quantified Strategies

