First of all, what is correlation? Correlation is a situation where there is a mutual relationship between two things.
The concept can be applied in most industries. For example, there is a correlation between the more time you spend exercising and how much weight you will lose. Similarly, there is a relationship between how it rains and how productive farmlands are.
Similarly, the same concept happens in the financial market. In this article, we will look at how you can use correlations (and in which assets) when day trading.
Table of Contents
What is a correlation in day trading?
As mentioned above, correlation is the concept of relationships that happen between two assets. For example, in most cases, mining stocks like BHP and Glencore do well when the prices of their assets rise and vice versa. Similarly, airline stocks tend to underperform when the price of crude oil rises. Furthermore, they will need to pay more money for fuel.
These relationships happen across all asset classes like stocks, bonds, currencies, and commodities. They also happen in exchange-traded funds (ETFs).
How to calculate
The process of calculating correlation is relatively simple. Though at times it is never needed. The easiest way of doing this is using Microsoft Excel, Google Sheets, and other platforms. You simply need to download data of the two assets you want to analyze. Some brokers provide this data in an easy way to download. After downloading the data, you need to load it in the spreadsheet and then run the correlation function.
The longer route of calculating correlations is as shown below. As you can see, this process is relatively complicated.

For currencies, you don’t even need to calculate the correlations yourself. That’s because many websites do the calculations automatically. The chart below shows the currency correlation table provided by Oanda.
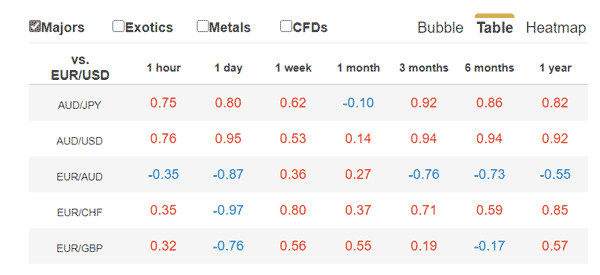
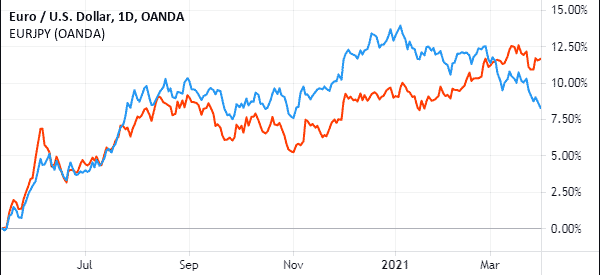
In this chart, we see that the EUR/USD has a close correlation with the EUR/JPY in the past 1 year. This is evidenced by the chart below.
How to read correlation between assets
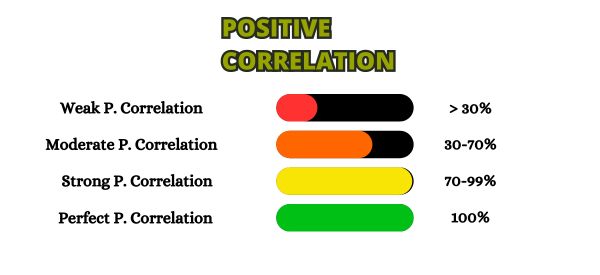
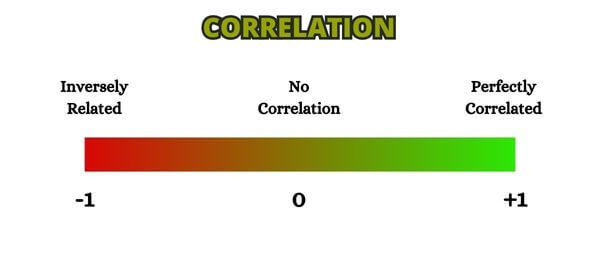
As you will realize, the correlation figure will be between -1 and 1. In a perfect situation, if the two assets have a correlation of 1, it means that they are perfectly correlated. This means that the price of the two will always move in the same direction. If the result is zero, it means that the two assets don’t have any relationship. Finally, if the result is -1, it means that the two assets are inversely related.
How to day trade using correlations
A common question asked is how one can use the concept of correlations in day trading. Ideally, you can trade correlated and uncorrelated assets.
Close relationship
For example, if two assets have a close relationship, you can take advantage of the situation by buying one and shorting a small portion of the other. In this situation, if you are right, the first asset that you bought will become profitable while the other one will make a loss. The profit will be the difference between the profit and loss.
Related » What’s a Sympathy Play in Stock?
Uncorrelated assets
You can use the same concept to trade uncorrelated assets. Here, you will buy the two of them and if the price works right, the profit will be the difference between the two. You cannot apply the concept of correlations when the two assets have no relationship.
Commonly correlated assets
Some financial assets are known for their correlations. Let us look at some of the examples.
Main indices
An index is a financial asset that tracks a combination of stocks. The most popular indices in the market are the Dow Jones, S&P 500, Nasdaq 100 and the Nikkei 225.
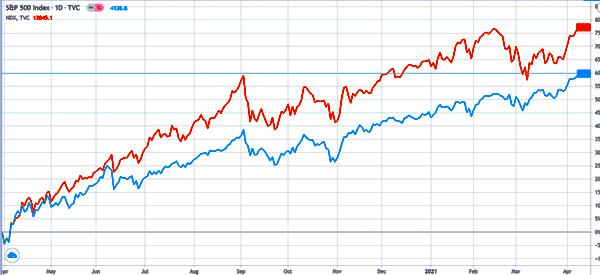
In most cases, the major indices tend to move in the same direction. Typically, the S&P 500 and Nasdaq 100 will rise or fall in a certain period. That’s because they are often moved by the same things such as interest rates and geopolitical issues.
Most importantly, global indices also have some relationship. If the US indices like the Dow Jones close deeply in the red, there are high chances that Asian indices will open lower.
Currency pairs
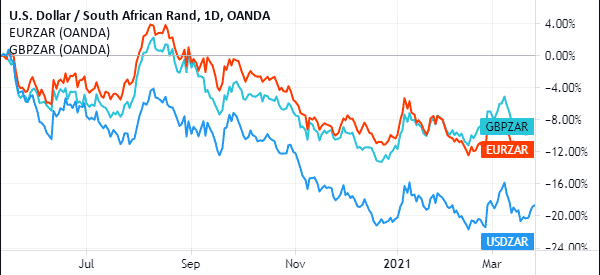
Similar currency pairs tend to have a close relationship with one another. A good example of this is an emerging market currency paired with other developed market countries. For example, if the USD/ZAR pair rises, chances are that the EUR/ZAR and GBP/ZAR will rise as well.
Similarly, if the USD/TRY rises, other currencies like the EUR/TRY and GBP/TRY will also rise, and vice versa. That’s because the common denominator here is that the EM currencies are falling against developed market currencies. This is shown in the chart below.
»Understanding and maximizing currency correlations«
Similar stocks
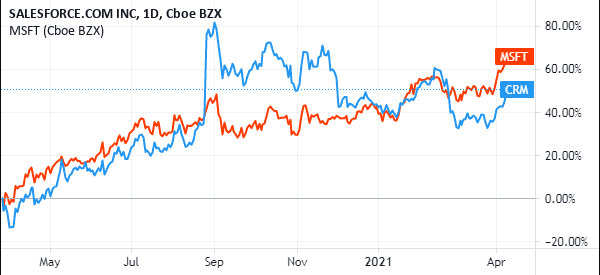
Some stocks tend to have a close relationship with each other. For example, in most cases, oil and gas companies like Chevron and ExxonMobil tend to move in the same direction. Similarly, companies in the technology space usually move in the same direction.
The chart below shows the relationship between stocks like Salesforce and Microsoft.
Benefits of using correlations in day trading
There are many benefits of using correlations as a day trader. First, it can help you minimize risks associated with the market. For example, buying the EUR/ZAR and USD/ZAR pairs may expose you to risks since they tend to move in a similar direction. If the trades work, you will make money but if they move in the opposite direction, you will lose more money.
Second, using correlations is a good way to hedge your trades. If you are long a financial asset, you can easily hedge these risks by trading an asset that has a relationship with it.
Summary
Correlation is an important aspect of the financial market. If you use it well, you can avoid making the popular mistakes that many day traders make. Also, it can help you make money with minimal risks in the long term.


