

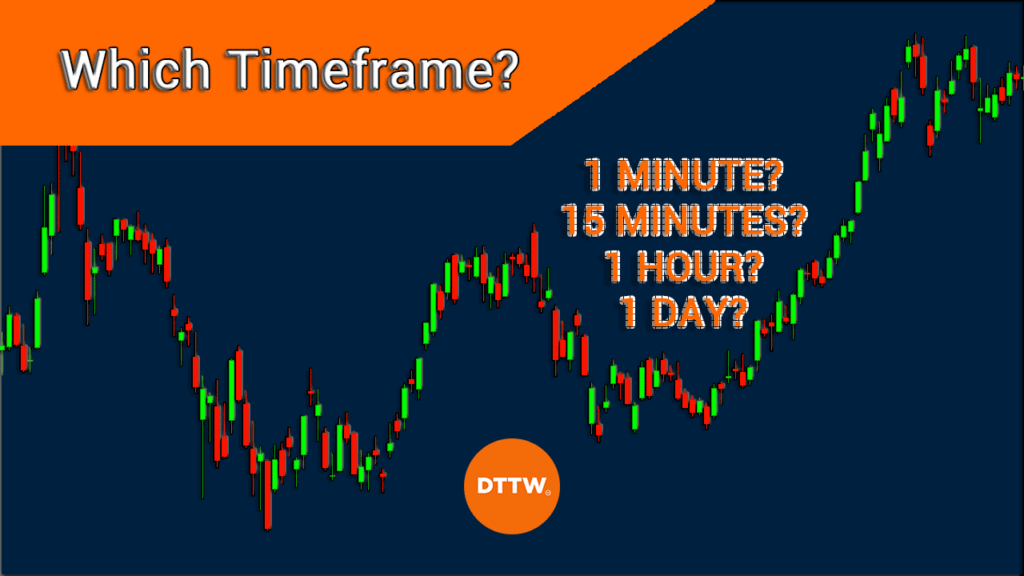
Timeframes are an important part of day trading and investing. In fact, a simple mistake on timeframes can lead to major losses or complexity.
For example, a scalper using a daily chart will always make a mistake predicting the next moves. The same is true for a swing trader (or investor) analyzing 1-hour or 4-hour charts. You will get valuable information…but not for what you would like to analyze.
In this article, we will explain the concept of timeframes and assess the idea of multi-timeframe analysis trying to help you in understanding what charts you actually need.
Table of Contents
What are timeframes in trading?
A timeframe refers to the period traders are using to analyze their charts. The timeframe can range from one minute to a year. As a result, in a one-minute chart, each candlestick that you see represents one minute. If you add those bars to 60, it will represent one hour.
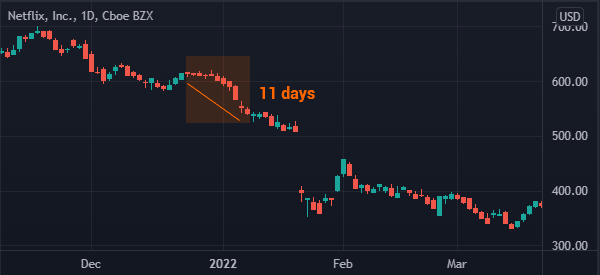
A good example of this is shown in the Netflix chart below. As you can see, this is a daily chart, meaning that each candle represents a single day. As shown, the price of Netflix declined in eleven consecutive days.
It is also worth noting that candlesticks are the most useful trading charts in trading. They are better than other chart types because a single bar usually shows OHLC, which stands for Open, High, Low, and Close.
Timeframes in trading and investing
There are several types of market participants in trading. And these market players use different types of timeframes to make decisions. For example, an investor who hopes to hold an asset for a year will have no use for a one-minute chart.
Such a chart will not have any meaningful use to such a trader. In fact, they could cause wrong signals. At times, a chart may be rising in a one-minute chart and fall sharply in a longer-term chart.
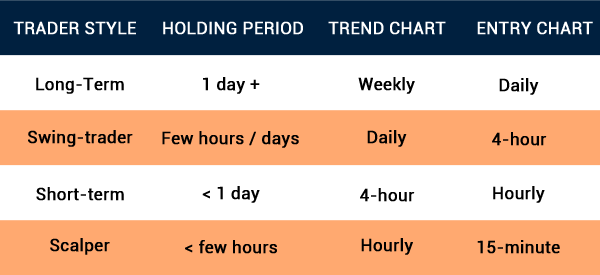
Scalpers
Scalpers are traders who focus on extremely short timeframes. They achieve success by opening tens of trades per day and exiting it within a short period. It is possible for a scalper to open a trade and then close it in the next two minutes.
Therefore, these traders focus on extremely short timeframes between 1-minute and 5-minutes. But not more than 15 minutes.
Day traders
Day traders are those traders who also open multiple trades per day. These traders usually open trades and ensure that they are closed before the market closes. They typically use extremely short timeframes, with a maximum of 15 minutes.
» Related: The complete guide to day trading
Swing and investors
Swing traders are pattern participants who focus on a numerous number of days. They buy assets and then hold them for two or more days. These players are not averse to overnight risks. They focus on medium-timeframes charts such as 30-minute and hourly.
Finally, there are long-term investors who buy and hold assets for a few weeks or months. These investors use longer charts like daily, weekly, and monthly.
Multi-Timeframe analysis
In most cases, it is recommended that traders should embrace what is known as a multi-timeframe analysis. This is a situation where you focus on doing your analysis on multiple charts to identify the overall pattern and support and resistance points.
Still, the process of a multi-timeframe analysis should put the type of a trader into perspective.
For example, it would not make sense for a scalper to do a multi-time frame that starts from a monthly chart. Similarly, it does not make sense for a long-term trader to use a one-minute chart.
The rule of three
One of the most popular approaches when identifying the right timeframe is known as the rule of three. The concept is that you should always look at the price action in three timeframes before you open your trade.
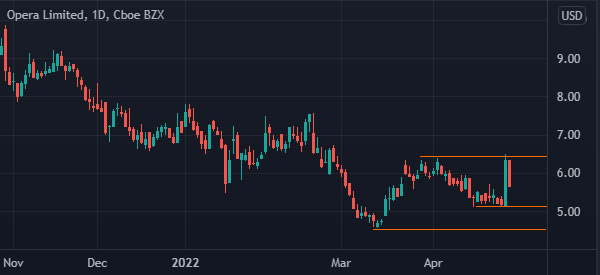
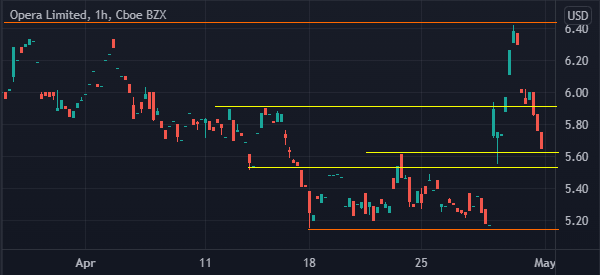
Some day traders start with a longer chart such as daily in order to see the overall trend of the asset. In this stage, they will identify several support and resistance levels. For example, in the chart below, we see that the Opera share price was moving sideways. We then identified the key levels of significance.
After this, a day trader can move to a hourly chart and see where these support and resistance levels are in terms of their pricing. In this stage, one should also map more support and resistance points as shown in yellow.
In the final part, a day trader can move to a 15-minute chart and see the price action and then make trading decisions.
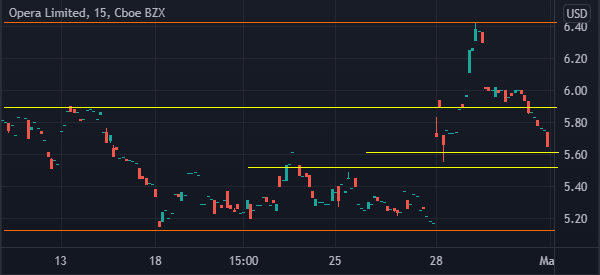
By doing this multi-timeframe analysis, one can be able to make better trading decisions. In the three charts above, we see how the support and resistance in the daily chart are significantly further than those in the 15-minute chart.
Summary
The rule of timeframes is to ensure that you keep them as simple as possible. Focus on just a handful of charts before you enter a trade but don’t overdo it.
By using the rule of 3, it will help you make a good decision on whether to buy or sell and the right levels to add your support and resistance points.
External useful resources
- Multiple Time Frames Can Multiply Returns – Investopedia

