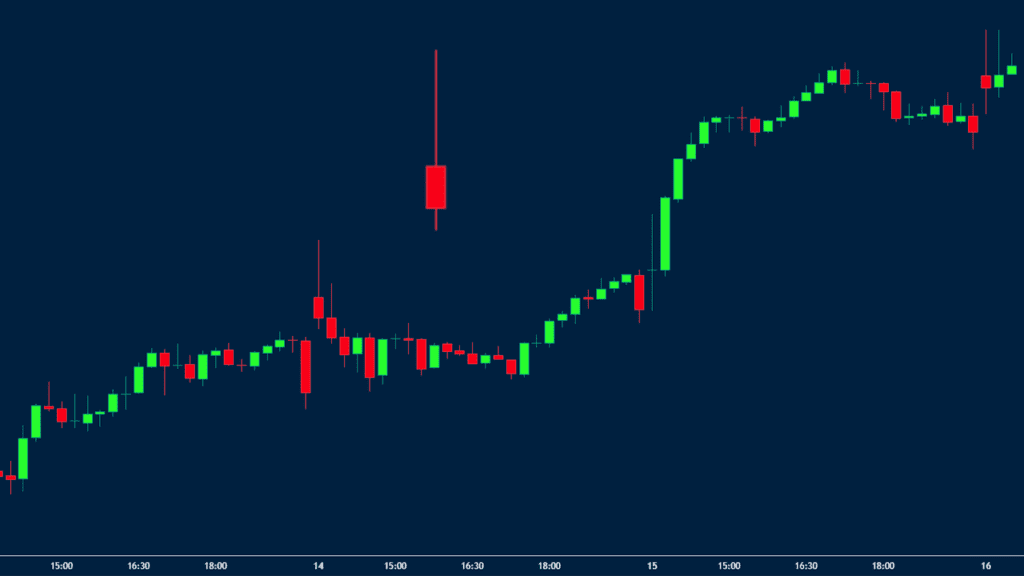
Dojis are popular candlestick patterns that form when an asset opens and closes at the same point. The pattern happens in all types of assets, including currencies, stocks, commodities, and shares. It also happen in all timelines, including minutes, hourly, four-hour, and daily charts.
There are three main types of doji patterns, which include the classic doji, dragonfly doji, and the gravestone doji. In this article, we will look at the gravestone doji and how you can trade it.
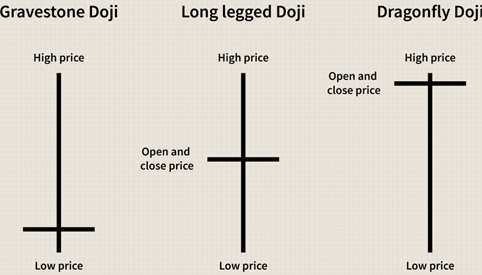
Table of Contents
What is a gravestone doji candlestick?
A gravestone doji happens when a candle opens, rises, and then ends at exactly at the point. You can see this in the chart above. When the opposite happens – when it opens, falls, and then closes at the open – is known as a dragonfly doji.
The gravestone doji derives its name from its appearance. According to Steve Nison, author of Beyond Candlesticks, it is called so because it resembles a wooden memorial that is placed at a Buddhist gravestone. As such, it is said that those who come and buy at a higher price than this will die and become ghosts.
Ideally, the gravestone doji is usually a reversal pattern, especially when it happens after a strong rally of an asset. This is because it signifies that the price opened, reached a high, and then sellers came with a vengeance and pushed the price lower.
Gravestone Formation
As shown above, the gravestone doji pattern forms when a candlestick has a long upper shadow and a small body at the lower side. It forms when an asset’s open, low, and close prices are the same. It happens when buyers have enough momentum to push the price higher but they then run out of steam.
Related » How shadow works in candlesticks
A gravestone doji can happen in both a bull run and a bearish trend. When it happen in an uptrend, the price normally opens and then shoots upwards and then drops and closes at the opening price.
On the other hand, when the gravestone doji happens in a bearish trend, the price opens at a lower level, attempts to recover, and then close at the opening price.
Gravestone doji vs dragonfly doji
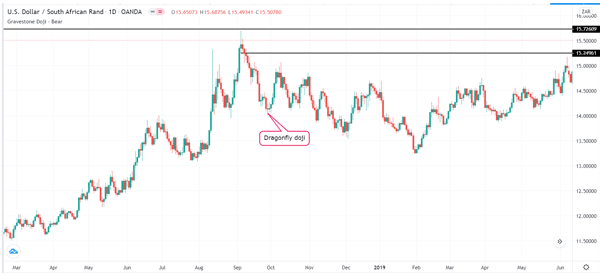
As shown in the first example above, a dragonfly chart is the exactly opposite of the gravestone doji. It happens when the price opens, falls, and the bulls push it higher to the open. A good example of this is shown below.
Gravestone vs shooting star
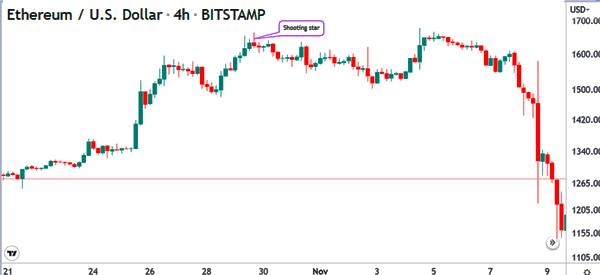
A common question among many traders is on the difference between the shooting star pattern and a gravestone doji. As shown below, the shooting star pattern has a close resemblance to the gravestone doji pattern.
The only notable difference is that the shooting star pattern has a small body while a gravestone doji has no body.
How to use the gravestone doji in trading
The first step of trading with the gravestone and all other types of doji patterns is to identify a trending asset. This is because these candlestick patterns do not provide quality signals in a ranging market.
The second step is to identify when the gravestone doji pattern happens. A good example of this is in the chart below. As you can see, the price reversed when the Doji pattern happened.
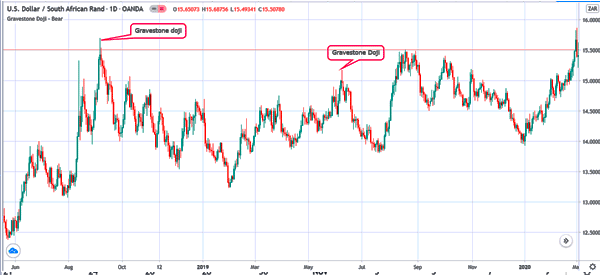
However, it is worth nothing that not all gravestone doji patterns are usually a sign that a bearish reversal is about to happen. This is mostly when the trend is relatively young.
Therefore, to identify the right gravestone doji, we recommend two things.
How to identify the right gravestone (and avoid false one)
Look for special relationship
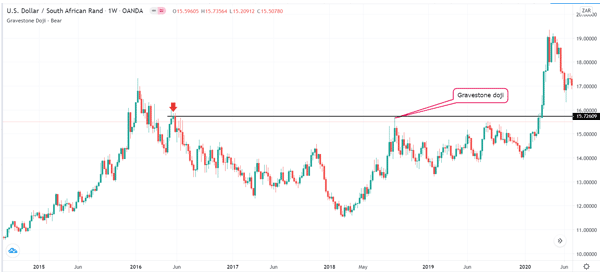
First, look at the highest point of the Doji and see whether there is a special relationship. You can do this by looking at the existing chart or another timeframe. On the chart above, since there is no immediate relationship, we checked any relationship on the weekly chart.
On the weekly chart, we can see that the upper side of the gravestone doji is close to the highest level in May 2016. This validates that the pair is indeed reversing.
Use with pending orders
Second, another approach of using the gravestone doji is to use it with pending orders. A pending order basically tells a broker to initiate a trade only once a certain price is reached.
Ideally, the importance of using these orders is to limit potential losses. For example, in the chart above, since the upper side of the gravestone doji is at 15.7260, you can place a sell stop trade at 15.2496, which is the lower side of the doji.
In this case, if the doji turns out to be a real bearish reversal, then, the trade will be initiated at 15.2496.
Pros and cons of using gravestone doji
There are several pros and cons of using a gravestone doji candlestick pattern. First, the pattern is easy to identify, as shown above. Second, it is relatively easy to use to identify reversals.
Third, the gravestone doji tends to be a relatively accurate method of identifying reversals. Finally, it can easily be used together with other technical analysis tools.
And the main con of the gravestone doji? The major issue comes When it is not used well, because it can lead to false signals. But this is not the only limitation.
Other cons of the gravestone doji are:
- It is rare – A gravestone doji is extremely rare when it forms.
- It takes to trade it – In most cases, it is recommended to wait before you enter a trade.
- It forms inside the trend – The gravestone doji can happen as the trend continues.
Final thoughts
The gravestone doji is an important pattern that is used to identify reversals in all types of assets. It is an easy-to-spot tool that is also easy to interpret.
Still, for new traders, it is recommended that you always be careful when using the pattern because at times, it usually does not signify a reversal.
External Useful Resources
- Trading Setups For Bearish And Bullish Gravestone Doji – TradingInvestment


