

Technical indicators are essential tools that help traders of all sizes predict how stocks, cryptocurrencies, currencies, and other assets will move. In the past few months, we have explored some of the popular indicators like the Relative Strength Index and other unpopular ones like the Keltner Channel.
In this report, we will look at the Fisher Transform indicator, which is a relatively unpopular oscillator.
Table of Contents
What is the Fisher Transform?
The Fisher Transform indicator was created by John F. Ehlers, an academic professional and trader who has written widely. The indicator, which is not very popular in the financial market, is not available in most trading platforms like MetaTrader. Instead, you have to install it by downloading and loading it on the platform.
When applied, the Fisher Transfrom appears similar to other indicators like the MACD and Stochastic Oscillator. The indicator has two lines that move up and down. One of the lines is known as Fisher while the other one is known as the Trigger. The other horizontal lines range between 1.5 and -1.5.
Therefore, as with all similar indicators, traders watch closely areas where the two lines intersect. Therefore, most traders use it to identify where new trends are forming. They also use it to identify divergencies.
How to Trade with the Fisher Indicator
Using the Fisher Transform is relatively easy. First, you need to have a chart that is either trending upwards or downwards. We believe that it is not useful when the price of an asset is ranging.
Second, you need to set the indicator well. This means that you should select the periods that you want to use. Most platforms have the default as nine but you can change it to suit your trading style. We recommend that you leave it unchanged.
Finally, in most cases, we recommend that you combine the Fisher Transform with other indicators like the moving averages and Parabolic SAR.
Bearish Reversal
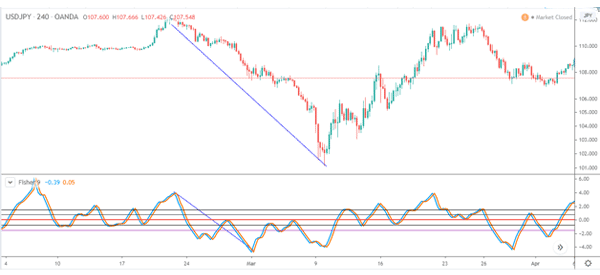
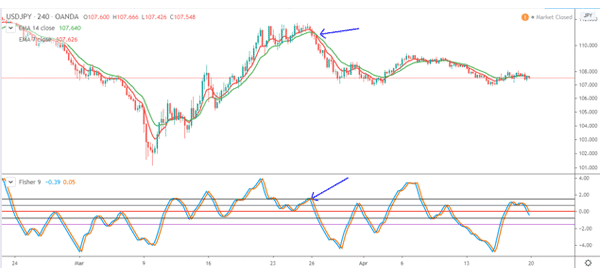
In the chart below, we have applied the Fisher Transform indicator on the four-hour chart of the USD/JPY pair. In this example, take note of the blue trend lines.
As you can see, the USD/JPY pair started moving lower when the Fisher line and the trigger lines made a bearish reversal. The pair continued to decline until the two lines made a bullish divergence.
Crossovers
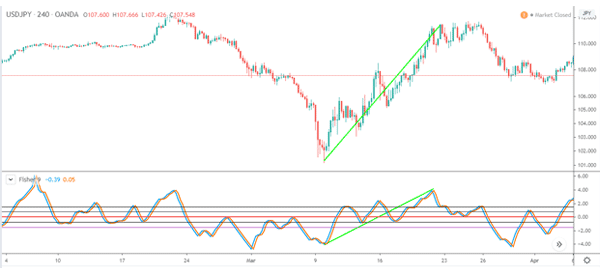
In the chart below, we see that the pair started a bullish trend when the two lines made a crossover. This is shown in the green lines shown below.
Divergencies
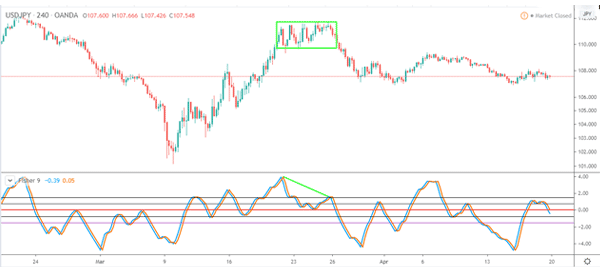
The third way of trading using the Fisher Transform is to identify divergencies. As shown below, after the USD/JPY pair ended the upward trend, the pair started to consolidate.
As this happened, the two lines of the Fisher Transform started to fall. This was a signal that the price would decline. This happened as shown on the chart below.
Other examples
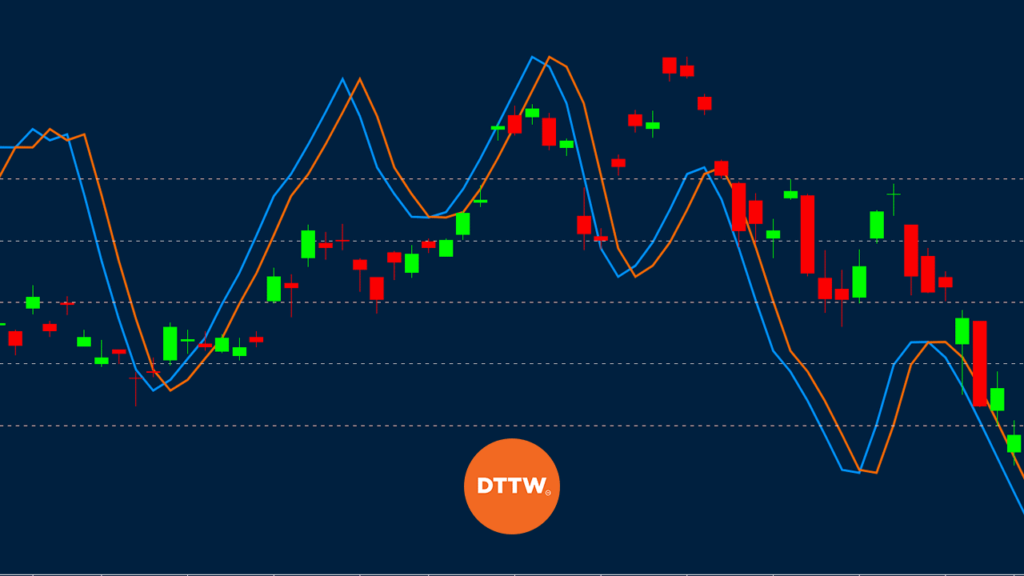
Finally, you can use the indicator in combination with other indicators. One of the most popular way is to combine it with the double moving averages. By using this strategy, you identify reversals when the two moving averages line cross one other. The benefit of combining the two indicators is to avoid false breakouts.
A good example of this is shown below.
Fisher Indicator comparisons
Fisher Transform vs Stochastic
A closer look at the Fisher Transform indicator applied on a chart shows that they have a similar resemblance to the Stochastic oscillator as shown below.
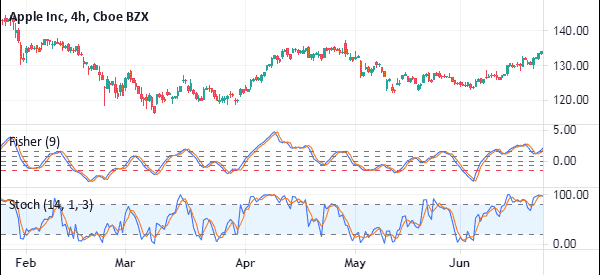
The two indicators have several key differences. The main is how the two are calculated. The calculation of the Stochastic oscillator starts with the calculation of %K and %D.
The %K is calculated by first subtracting the lowest low from the current close. You then minus the lowest low from the highest high. Finally, you divide the two and multiply by 100. The %D is then calculated as the 3-day SMA of %K.
Still, the two indicators are used in the same way. First, you can use the two to identify the oversold and overbought level. Second, you can use them to follow the trend. The two indicators will mostly rise when the price is rising and fall when the price is falling.
Also, you can use their crossovers to identify buying and selling signals.
Fisher Transform vs RSI
The Fisher Transform indicator also has a close resemblance to the Relative Strength Index (RSI). The chart below shows the Fisher Transform and the RSI index in a chart.
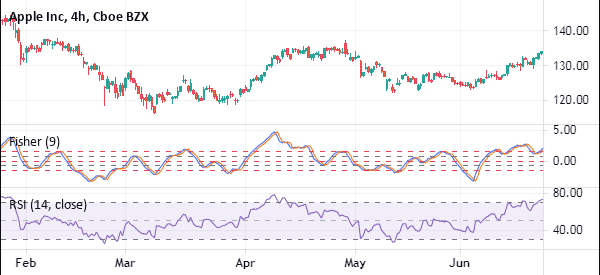
The two indicators are different in how they are calculated. You can find the process of calculating the RSI in our guide here.
Yet the two indicators are used in a similar way. They can be used to find overbought and oversold levels. Further, they can be used to find divergences and in trend following.
Fisher Transform vs Bollinger Bands
The Fisher Transform and Bollinger Bands have a very different appearance.
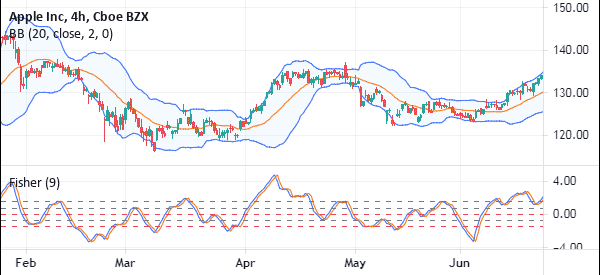
While the Fisher Transform is an oscillator, Bollinger Bands is a trend indicator. The two are also calculated in a different way since the Bollinger Band is calculated by finding the moving average first and the standard deviations.
The Fisher Transform and Bollinger Bands can be used to complement each other. For example, you can use the Fisher Transform to confirm a bullish signal by Bollinger Bands.
Advantages of Using the Fisher Transform Indicator
There are two main benefits of the Fisher transfer indicator. First, it is a relative easy-to-use indicator to use. As shown above, the signals identified by the indicator are relatively easy.
Second, the it is relatively easy to use the indicator with other indicators. Third, it is an indicator you can use on both forex, stocks, indices, and other indicators.
In conclusion, we recommend that you take time in the demo account to come up with the trading strategy. We also advise that you adjust the periods to see how they react with your asset.
External useful Resources
- How Fisher Transformation Can Help You Anticipate Turning Points? – Quantshare

