

The Chande Momentum Oscillator (CMO) is a relatively rare technical indicator that helps to measure the overall momentum of an asset.
It was developed by Tushar Chande, a technician and scholar with more than two decades in the money management industry. He has developed other trading systems and written several books like Beyond Technical Analysis.
In this report, we will look at how the Chande Momentum Oscillator works, how to use it, and some of the alternative indicators.
Table of Contents
What is the Chande Momentum Oscillator
The CMO is a technical indicator that helps traders see whether a stock or any other financial asset has momentum behind it. Ideally, many traders love to buy assets that have a bullish momentum and short those that have weak momentum.
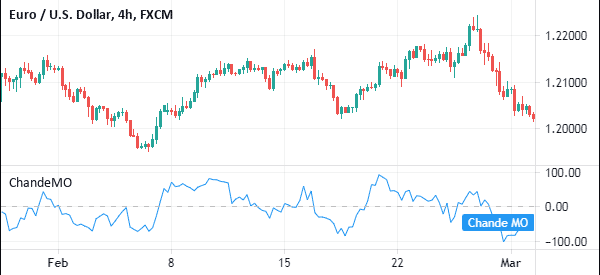
When applied in a chart, the CMO is usually a single line that moves up and down. It has a zero line, which is often the most important part of the indicator. It ranges from minus 100 to positive 100.
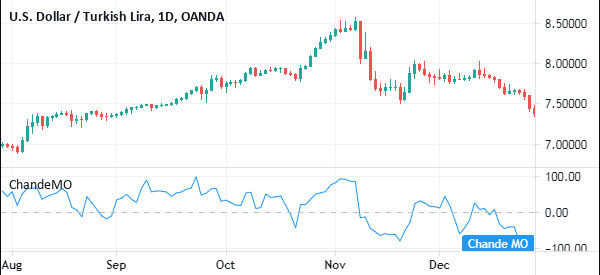
The chart below shows a CMO that is applied in a daily chart.
The CMO is available as a built-in indicator in the TradingView. However, it is not built-in in MetaTrader 4 and 5, meaning that you need to download and install it directly from the marketplace.
How this oscillator is calculated
All technical indicators are calculated using mathematical calculations. However, as we have written before, as a day trader, you don’t need to know how to calculate these indicators. Instead, all you need to know is how to apply the indicator and how to interpret it in a chart.
The formula for the CMO is:
| (Su – Sd) / (Su + Sd) X 100 |
The Su is the sum of the difference between today’s close and yesterday’s close. Sd, on the other hand, is the difference between today’s close and yesterday’s close on down days.
How to set up the Chande Momentum Oscillator as a day trader
The Chande Momentum Oscillator has a similar appearance to the MACD, Chaikin, and Detrended oscillators. It has a single line that moves up, down or sideways, following the asset. It is usually ideal for both traders and investors.
A common question, therefore, is on how to set it up for a day trader. Unlike other oscillators, setting this one is quite simple since all you need is the length and the source. In length, we recommend that you use the default one (9) while on the source, you should leave it at close.
However, you can always experiment with different time frames to see the one that works fine.
Chande Oscillator vs Stochastic Oscillator
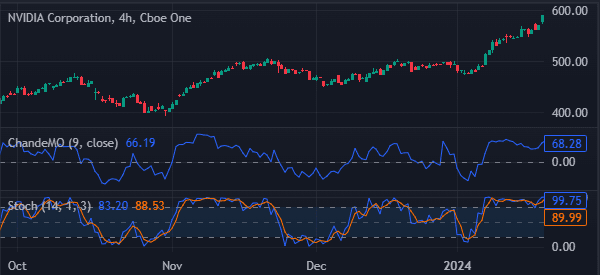
The Chande Oscillator and Stochastic Oscillator are both used to do the same things such as trend-following, identifying reversals, and identifying overbought and oversold levels.
But the two indicators are different. For example, the Stochastic oscillator has two lines that move up and down. It also has two lines that show the overbought and oversold levels. Also, the indicator aims to show the speed of and momentum of price movement.
It was based on the concept that an asset’s price does not follow the price or volume but the speed or momentum. The chart below shows the two indicators applied in the same chart.
Chande vs Keltner Channels
Chande and Keltner Channels are two different indicators that can be used together. While Chande is an oscillator, Keltner is a channel one that has a close resemblance to Bollinger Bands. It is calculated by first establishing the middle line, which is usually the 20-day exponential moving average (EMA).
You should then calculate the upper and lower channel lines. These channels are calculated using the following formulas.
Upper Channel Line: 20-day EMA + (2 x ATR(10))
Lower Channel Line: 20-day EMA – (2 x ATR(10))
The main difference between the two is that Keltner is used in trend-following while Chande is an oscillator that is mostly used to find extremes.

Chande Momentum Oscillator Strategies
Using the CMO is a relatively easy process. First, you need to ensure that the chart is trending upwards or downwards. This is important, because, like many oscillators, it does not work well when the price of an asset is ranging.
Second, you need to select the indicator and add the period you want to study. The default in most platforms is usually 9 days.
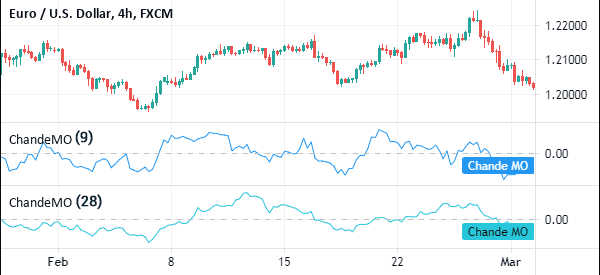
However, as a trader, we recommend that you spend a substantial amount of time testing different periods to see the one that works well for you. Some will find using a longer period being better than a shorter period.
The chart below shows the 9-period and 28-period Chande Oscillator applied in a EUR/USD chart.
Identifying overbought and oversold levels
The first approach of using the Chande Momentum Oscillator is to identify overbought and oversold levels. An asset is said to be overbought when the oscillator nears 100. In this case, it can be ideal to place a short trade.
Similarly, when it dips substantially, the asset is usually said to be oversold.
However, while this is a popular strategy, at times, it will produce the wrong outcome. In fact, many day traders prefer buying when the MCO is nearing the overbought levels and vice versa. That’s because, when it is in extreme levels, it means that there is a strong momentum behind it.
The zero line
Another approach of using the Chande Momentum Oscillator is to identify the zero line. In this, if the price of an asset is rising and the CMO crosses the zero line, it is usually a sign that momentum is building-up. Therefore, it is a sign to either buy or continue holding the asset.
However, if there is a reversal and the indicator moves below the zero line, it could be a sign to exit a trade.
Similarly, if the price of an asset is falling and the CMO crosses the zero line, it is a sign that the sell-off is gaining steam.
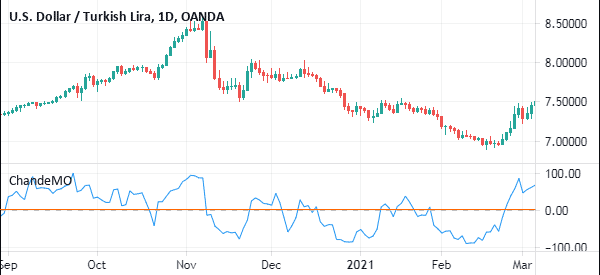
The chart below shows that the USD/TRY pair remained in a bullish trend when the price was above zero. It was also below zero when the price was in a bearish trend.
CMO and EMA crossover
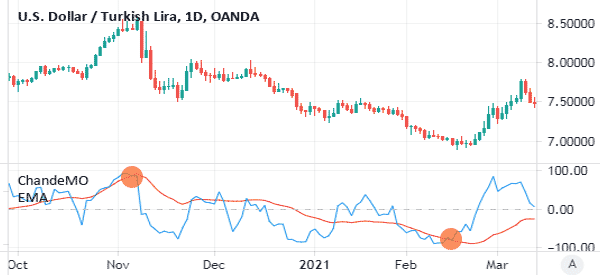
Another way of using the CMO is to combine it with a moving average. In TradingView, you can easily overlay a moving average on top of the Chande Oscillator. It is relatively difficult to achieve that on the MT4 or 5.
The idea is to add an exponential moving average on top of the CMO and identify the crossover levels. In the chart below, we see that the price dropped when a bearish crossover happened and vice versa.
Use the Chande Momentum Oscillator to trade reversals
The other approach for using the CMO indicator is to find reversals in charts. A reversal is a period where a financial asset moving in a certain direction changes direction. For example, if a stock is in an uptrend, a reversal happens when it starts moving in the opposite direction.
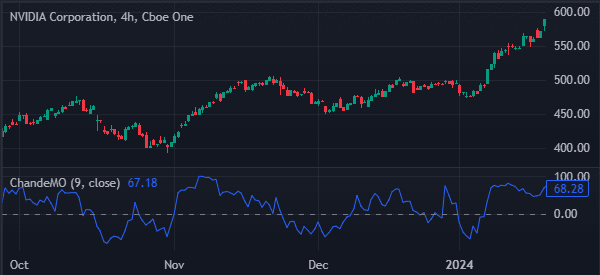
You can use the CMO indicator to find these reversals. In most cases, they will happen when the indicator starts to change direction.
A good example of this is in the chart below, where the indicator turned around signaling that a reversal was around the corner.
Final thoughts
The Chande Momentum Oscillator is an important tool to use in the market. Some of its advantages are that it is easy to use and that it tends to be relatively accurate. The top cons are that it is not included as a default in most trading platforms like the MT5 and 5.
In addition to the CMO, other momentum indicators you can use are Momentum, the Average Directional Movement Index, Momentum Acceleration, and the Relative Strength Index (RSI).

