

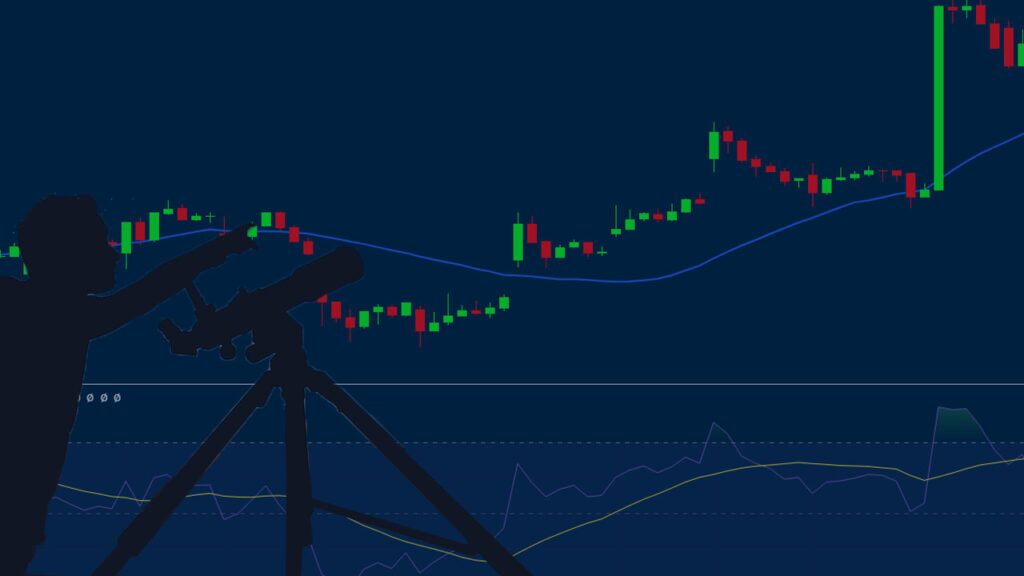
Technical analysis is an important part of both day trading and investing. It has several parts, including using technical indicators like moving averages and the Relative Strength Index (RSI).
It also involves price action analysis, which involves using chart patterns like triangles, rectangles, and head & shoulders. The other part of technical analysis is the use of candlestick patterns like doji, bullish engulfing, and morning star to predict reversals and continuations.
This article will focus on technical indicators and how to use them in day trading. Precisely, we will look at leading indicators, which are great in predicting the next price movement of financial assets.
Table of Contents
Leading vs lagging indicators
Technical indicators can be divided into several categories. First, there are indicators like trend, oscillators, volume, and momentum. Trend indicators include the likes of moving averages and the Bollinger Bands while oscillators are tools like the Relative Strength Index (RSI), Stochastic Oscillator, and MACD.
Volume indicators are tools like accumulation/distribution, Money Flow Index (MFI), and the Volume Weighted Average Price (VWAP).
The other category is made up of leading and lagging indicators. Lagging indicators typically use historical data to provide delayed feedback of an asset. Leading indicators, on the other hand, anticipate future price movement of assets.
In most cases, leading indicators are used to predict the future of an asset while the lagging ones are used to confirm the trend.
Top leading indicators to use in charts
Andrews Pitchfork
Andrews Pitchfork is not necessarily a technical indicator. Instead, it is a technical tool that can help you identify the next key levels to watch.
It is made up of five lines, with the middle one being the median line. This line is then surrounded by two support levels and two resistance levels.
The pitchfork tool is drawn by connecting a lower swing and two other parts, as shown below. After drawing the tool, one can use several approaches to trade it. For example, you can use it in trend-following by placing a buy trade when it is moving from the second support towards the median line.
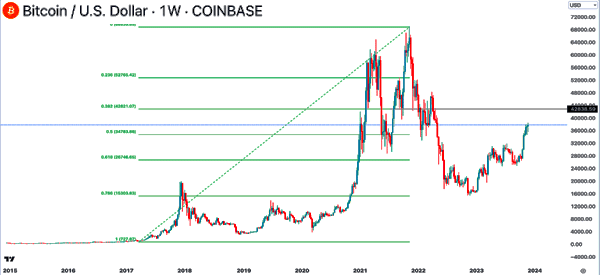
Fibonacci Retracement
Like the Andrews Pitchfork, the Fibonacci Retracement tool is not a technical indicator. Instead, it is a tool that has been used for decades to identify potential levels that an asset will test. It is based on the mathematical concept of Fibonacci sequence in which each number is the sum of the two preceding ones.
The Fibonacci Retracement tool is drawn by connecting the lower and upper swings of an asset. After doing this, the tool will show several levels starting from 23.6%, 38.2%, 50%, 61.8%, and 78.6%, respectively.
You can then use the price of the asset to predict where it will move to next. On the weekly chart below, we see that Bitcoin has been in a strong rally. By plain eyes, it is hard to predict the next level to watch.
With the Fibonacci Retracement tool, you can predict that the price will move to $42,838, which is the 38.2% Fibonacci level.
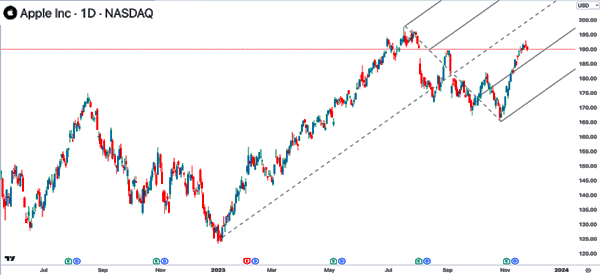
Pivot points
Pivot points are additional tools that use the current prices to predict the next levels to watch in an asset. They are used to identify support and resistance levels of an asset. They use the asset’s low, high, open, and close to do that.
There are several types of pivot points, including standard, Woodie, Camarilla, classic, and Fibonacci. These types differ in how they are calculated. Standard pivot points are calculated by first adding the high, low, close levels and then dividing by three.
The first support and resistance are calculated: (PX2) – High and (PX2) – Low. The second support and resistance are calculated: P – (High – Low) and P + (High – Low).
One of the easiest ways of using pivot points is to use the automated one by TradingView. In the chart below, we see that Apple shares were in a strong uptrend. They then moved above the second resistance, opening the possibility that they will move to the third resistance at $156.
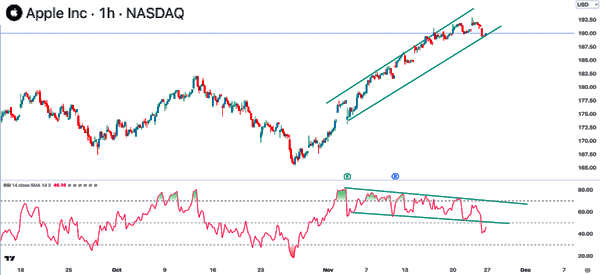
Relative Strength Index (RSI)
The Relative Strength Index (RSI) is one of the most popular indicators in day trading. It is an oscillator that is mostly used to identify overbought and oversold levels. In most cases, an asset is said to be overbought when it moves above 70 and oversold when it drops below 30.
The indicator is also widely used in other areas such as trend-following and divergences. In trend-following, traders buy assets when the indicator is in an uptrend and vice versa. A divergence happens when the RSI is falling while the price is rising. It is usually a sign that the price will have a reversal.
The RSI is calculated using the following formula: 100 – 100 / 1 + RS, where RS is the average gain divided by the average loss.
On the daily chart below, we see that the stock is in an uptrend while the Relative Strength Index (RSI) is falling. This is a good sign of divergence, signaling that the price will likely have a bearish breakout.
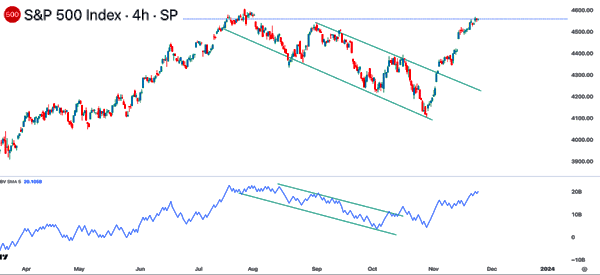
On Balance Volume
On Balance Volume (OBV) is one of the few breadth indicators that is mostly used in index trading. It aims to measure the buying and selling pressure of an index by adding volume up days and then subtracts volume down days. In its calculation, an up day happens when the price closes higher than the previous close.
The OBV indicator is widely used like other oscillators. It can be used in both trend-following and divergences. The chart below shows how the indicator is used in trend-following. As shown, it is in a downward channel as the price continues to fall.
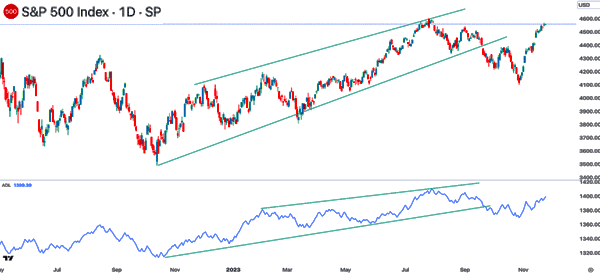
Advance Decline Line
The other important leading indicator is known as the Advance-Decline Line (ADL). It has the same concept as the On Balance Volume (OBV) but it focuses on the number of advancing or falling stocks. The net advances are usually positive when more stocks are rising compared to those that are falling.
The theory behind this indicator is relatively simple to grasp. If more stocks are rising, it sends a sign that there is a bullish momentum. If many stocks are crashing, it sends a sign that there are challenges in the market.
Like the OBV indicator, the ADL indicator can be used in both trend-following, finding overbought and oversold levels, and divergences. The chart below shows that the ADL line rose as the S&P 500 index continued its momentum.
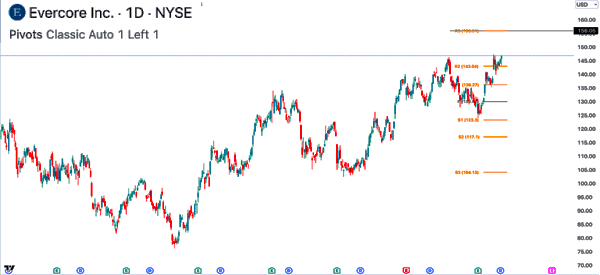
Awesome Oscillator
The Awesome Oscillator is another leading indicator that is used to predict the next moves of an asset. It is identified using the zero line and the red and green bars. The indicator is calculated by first establishing the 34-simple moving average (SMA). This price is then subtracted from the five-period SMA of median prices.
There are a few approaches for using the awesome oscillator to predict the next price movement of an asset. First, you can use it in trend-following, where you buy as long as the bars are green and rising. Similarly, you can short an asset when the awesome oscillator is retreating.
The other approach is to look at the awesome indicator’s twin peaks, which are often seen as the double tops. When these peaks happen, it is usually a sign that the asset will ultimately have a bearish breakout. The other approaches are the bullish and bearish saucers and looking at the zero line.

MACD
The Moving Average Convergence and Divergence (MACD) is another popular leading indicator. Its main goal is to transform moving averages into an oscillator. It is characterized by a middle zero line, two lines (MACD and signal), and histograms. The indicator does well by combining both trends and momentum.
The MACD is calculated by first subtracting the 12-day EMA from the 26-day EMA, which is now the MACD line. The signal line is calculated by establishing the 9-day EMA of the MACD line. Finally, the MACD histogram is calculated by subtracting the MACD line from the signal line.
The MACD is used in several ways. First, one can use the MACD and signal line crossover to find entry positions. When it happens below the middle line, it is a bullish sign. Similarly, when the crossover forms above the neutral point, it is a bearish sign.
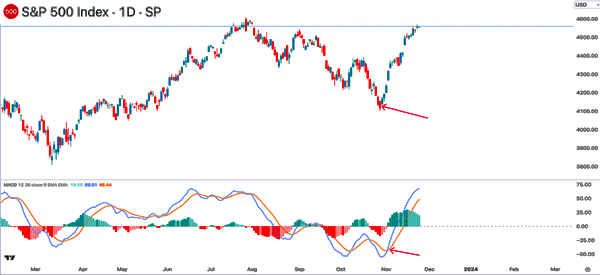
Second, the MACD can be used in trend-following, where you buy as long as it is rising. More upside is confirmed when the two lines and the histogram moves above the neutral point. Third, like other oscillators, the MACD can be used to find divergences.
Summary
Leading indicators are mostly used well in combination with lagging ones like moving averages and Bollinger Bands. It is also used well together with other chart patterns like double-tops and head and shoulders.
External useful resources
- Leading Indicators Defined and Explained – DailyFx

