

A successful career in day trading requires knowledge of when to strike and when to withdraw.
For traders familiar with the foundations, developing a keen eye for entry and exit indicators is the next step toward refining strategies. While price action analysis provides the groundwork, technical indicators offer deeper insights into market dynamics.
We will explore the best entry and exit indicators, explaining their mechanics, strategic applications, and how to integrate them with price action analysis. With better understanding of these tools, you can sharpen your timing, confirm signals, and navigate day trading markets with greater confidence.
The Importance of Precise Entry and Exit Points
Let’s first discuss what entry points and exit points are in general.They represent strategic decisions for a day trader to buy or sell assets based on predefined criteria aligned with their financial goals, risk tolerance, and analytical approach.
Traders find and determine these points with the help of specific indicators. But before we get into the how, we must understand why it’s essential to find these entry and exit indicators:
- Maximize short-term profitability: Small improvements in entry and exit prices can significantly boost profits, as you’re looking for the largest possible swing within a single day’s trading.
- Minimize risk exposure: Clear exit rules protect your trading capital from unexpected price drops.
- Preserve capital efficiency: Timely entries and exits allow you to quickly enter profitable trades and cut your losses.
In day trading, identifying entry and exit indicators depends heavily on both price action analysis and real-time market data, which can be interpreted with the help of technical indicators.
The Role of Price Action Analysis in Entry and Exit Indicators
Price action analysis is the study of how an asset’s price has moved in the past, without relying on indicators derived from mathematical formulas.
Day traders see the markets as price action first and foremost—i.e., raw market movement. Their goal is to interpret this data with a keen sense of market psychology, as this allows them to intuit buying and selling pressure as entry and exit indicators.
Identifying Patterns in Price Movements
Day traders analyse historical price action data via visual representation on a chart, and look for recurring similarities that often precede specific market behavior.
The similarities can be seen in individual candlestick patterns providing insights into buying and selling pressure, or in broader formations spanning multiple candlesticks, known as chart patterns.
In other words, by identifying patterns, day traders can get, at the very least, an educated hunch of where to place entry and exit points.
Recognizing Support and Resistance Levels
Support and resistance levels are zones where buying or selling pressure tends to accumulate.
- Support is a price level where demand outweighs supply, causing prices to bounce higher.
- Resistance is a level where the selling pressure prevents upward movement.
A successful day trader spots support and resistance levels and monitors the price behavior for signs of strength or weakness. If the stock price approaches a support level with bullish momentum, it could be an entry point for a long trade.
If resistance is spotted several times without a breakthrough, it could warrant entering short positions for a possible reversal.
Limitations of Solely Relying on Price Action
While a useful starting point, price action analysis is ultimately a subjective parameter, as it relies mostly on market psychology—and a trader’s own interpretation of what’s going on in the market.
This means that price action analysis might not always provide clear signals for entry and exit points.
And that’s why it needs a more objective complement: Technical indicators.
Train to Trust Your Gut and the Numbers
Before we discuss the best entry and exit indicators, we cannot escape the realization that day trading is a subtle mix of honing your gut feeling by price analysis, as well as interpreting the more mathematical technical indicators.
Similarly, traders with a lot of potential and drive to self-learn might underestimate the importance of a structured training program.
At Real Trading, we have veteran day traders with decades of experience under their belt training the next generation.
- Take our introductory course, followed by the advanced course, available online, on-demand 24/7.
- Get unlimited hours of risk-free trading practice with live market data on our simulator.
- Make your mistakes and learn from them without the fear of losing trading capital.
Don’t wait for potential to kick in; it can come only with training and an open mind.
Now, let’s discuss the best entry and exit technical indicators.
Key Technical Indicators for Entry and Exit Points
Technical indicators are mathematical calculations applied to historical price, volume, or other market data.
They are designed to help traders analyze past market behavior to forecast future price movements and identify potential trading opportunities—and entry and exit points.
As you can see, they serve a similar purpose to price action analysis, but from another perspective: Mathematical rather than psychological.
And some technical indicators are especially useful to identify entry and exit points.
1. Moving Averages
Moving averages are widely used technical indicators that help traders identify trends and potential entry or exit points. They smooth out price fluctuations, making it easier to spot the overall direction of an asset.
While there are several types of moving averages, two commonly used ones are the simple moving average (SMA) and the exponential moving average (EMA).
Moving averages can act as dynamic support and resistance levels, with traders often entering positions when the price crosses above or below them.
The chart below shows the EMAs (red), simple (blue), and hull moving average (black) indicators.
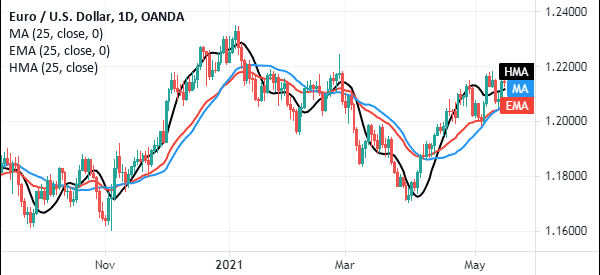
In conjunction with price action, moving averages are used to confirm trends and filter out market noise.
A moving average crossover strategy, where a short-term moving average crosses above a long-term moving average, is often used as an entry signal, while the reverse crossover can indicate an exit point.
2. Bollinger Bands
Bollinger Bands consist of a moving average with upper and lower bands set at a certain number of standard deviations away. These bands expand and contract based on market volatility, helping traders identify overbought and oversold conditions.
When the price touches the upper band, it may be an exit indicator, while touching the lower band can signal a potential entry.
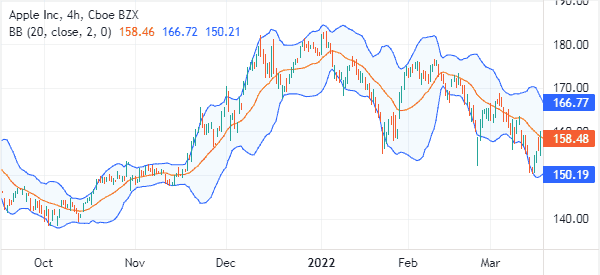
Day traders use Bollinger Bands to assess momentum and trend strength. If the price moves outside the bands and then reverts, it can signal a reversal.
Additionally, the bands contract preceding a breakout, helping day traders anticipate significant price movements.
3. MACD
Moving average convergence divergence (MACD) is a momentum indicator that identifies trend reversals and entry/exit points. It consists of the MACD line, signal line, and histogram, which visually represent the strength of price movements.
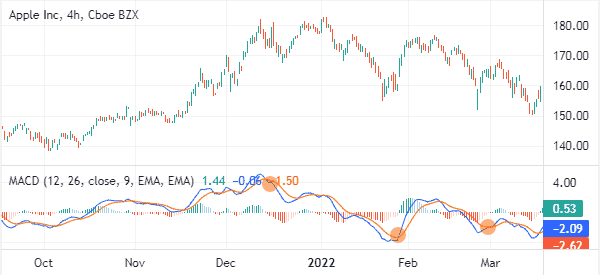
A bullish crossover, where the MACD line moves above the signal line, is often used as an entry signal, while a bearish crossover suggests an exit.
Day traders use MACD to confirm trends and momentum shifts. Divergences between MACD and price action can indicate potential reversals, while histogram bars growing larger suggest increasing momentum in the current trend.
4. Ichimoku Kinko Hyo
Ichimoku Kinko Hyo is a comprehensive indicator that provides insights into trend direction, momentum, and support/resistance levels. It consists of multiple components, including the Tenkan-sen, Kijun-sen, Senkou Span A & B, and the Kumo (meaning “cloud”).
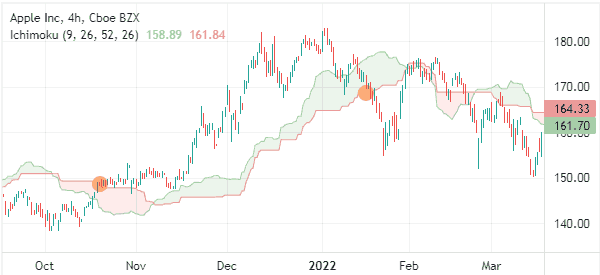
A bullish signal occurs when the price moves above the cloud, while a bearish signal happens when it drops below.
Ichimoku is used to confirm trends and filter out false signals. The cloud acts as a dynamic support/resistance zone, and crossovers between Tenkan-sen and Kijun-sen can indicate entry or exit points.
Additionally, the Chikou Span helps validate trend strength.
5. Stochastic Oscillator
The stochastic oscillator is a momentum indicator that compares an asset’s closing price to its price range over a set period. It helps day traders identify potential entry and exit points by signaling whether an asset is overbought or oversold.
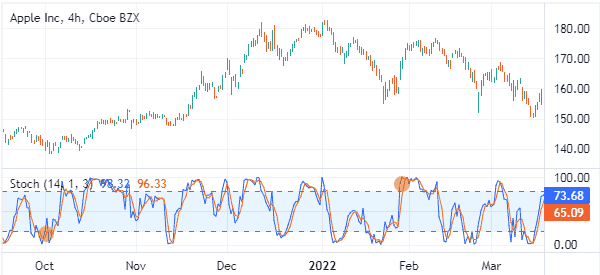
When the %K line (in blue) crosses above the %D line (in orange) in the oversold zone, it can be an entry indicator, while a downward crossover in the overbought zone may be an exit indicator.
The stochastic oscillator is used by day traders to confirm trends and reversals. If the oscillator indicates overbought conditions while the price forms a bearish reversal pattern, traders may prepare to exit or short the asset.
Similarly, an oversold reading alongside a bullish price pattern may suggest an entry opportunity.
6. Relative Strength Index (RSI)
RSI measures the speed and magnitude of price movements, helping traders determine whether an asset is overbought or oversold.
The indicator ranges from 0 to 100, with values above 70 often signaling overbought conditions (possible exit points), and values below 30 indicating oversold conditions (potential entry points).
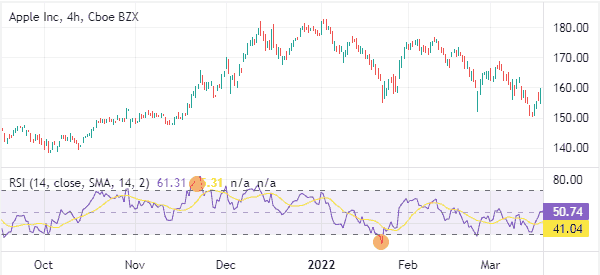
Day traders use RSI to gauge momentum and validate trends. When RSI moves above 50, it suggests strengthening bullish momentum, while a drop below 50 may indicate growing bearish sentiment.
Additionally, RSI divergences—when the indicator moves in the opposite direction of price action—can signal possible trend reversals.
When You’re Ready, You Won’t Have To Guess
It’s difficult to predict and spot every entry and exit point.
But when you get trained by the best at Real Trading, you slowly hone your ability to understand market psychology, chart reading, and interpret the indicators behind a profitable trade.
Start with our beginner course and work your way through the advanced course, learning advanced charting and locating imbalances.
Test everything you’ve learned on our TMS™ trading simulator and prove to yourself, and to us, that you have the skills and discipline to get funded.
You might have guessed on some of your trades, but after you train with us, you won’t ever have to.

