Moving averages are at the core of any day trading operation. As we have written before, they are among the best-known technical indicators you can use before.
Previously, we have looked at the exponential moving average (EMA) and the simple moving average (SMA). In this report, we will look at the Double Exponential Moving Average (DEMA), what it is, and how you can use it in the market.
Table of Contents
What is the Double Exponential Moving Average (DEMA)?
The double exponential moving average was developed by Patric Mulloy in 1994. It appeared in an article that appeared in the Stocks & Commodities magazine.
In it, he suggested that the common moving averages were not as accurate in providing trading signals. He attributed it to the lag factor because the indicators use historical data.
To solve this, he suggested using mathematical calculations to remove the lag in the exponential moving averages. And as we wrote before, the first step of calculating the EMA is to find the simple moving average.
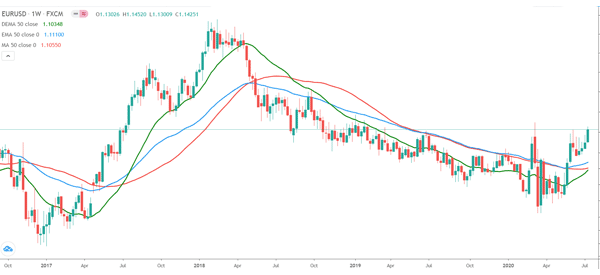
The chart below is a daily chart of the EUR/USD pair with the 50-day double EMA, 50-day EMA, and 50-day SMA. As you can see, the double EMA, which is shown in green, reacts faster than the EMA and SMAs.

How the DEMA is calculated
The double exponential moving averages calculation is relatively long. But, as we have noted before, it is not mandatory for you to know how to calculate indicators. All you need to know is how to apply them and interpret them.
It is also worth noting that DEMA is not found in most popular trading platforms like MT4. Instead, you need to manually install it by downloading it from the marketplace.
Step 1 – The SMA
The first step in calculating the DEMA is to calculate the simple moving average of the asset. The SMA is calculated by just adding the closing (or open price) of an asset and then dividing by the number of periods.
Step 2 – The EMA
The next step is to calculate the exponential moving average. You do that by using a multiplier. The example below shows how you can do this.
| Calculate the SMA: Sum of periods / periods |
Multiplier: (2 / (Periods + 1) )
| EMA: (Close – EMA (previous day)) x Multiplier + EMA (previous day) |
Final step – The Double EMA
Now, after finding the EMA, you need to go to the next stage and calculate the double EMA. You do this using the formula below:
| Double EMA = 2 x EMA – EMA (EMA) |
How to use the Double Exponential Moving Average
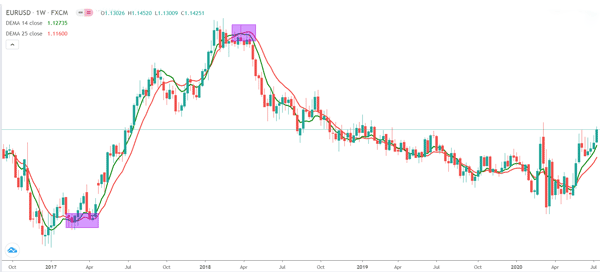
Using the double exponential moving average is relatively easy. Usually, We prefer combining a shorter double EMA and a longer-term EMA. In this case, you can use a 25-day DEMA and a 50-day DEMA.
When you do this, the goal is to find the area where the two lines intersect and find reversals. For this to happen, the asset’s price needs to be either moving upwards or downwards.
The chart below shows a 25-day DEMA and 50-day DEMA applied on the same EUR/USD chart shown above. As you can see, the price tended to reverse whenever the two DEMAs made a crossover.

Advantages of using the DEMA
There are several benefits you get by using the double exponential moving average. Among them are:
- It tends to lag less compared to the normal EMA and SMAs.
- The indicator is eerily similar to the Hull moving average, which is a popular indicator.
- It is easy to use as you can see above.
- It can be used to identify potential reversals and to confirm the strength of a trend.
- You can use indicator to analyse all asset classes, including stocks and bonds.
Final thoughts
The Double Exponential Moving Average (DEMA) is an excellent indicator to confirm the strength of a trend and to identify divergencies.
It is also an easy to use indicator that is similar to other popular indicators like EMA, SMA, and the Triple Exponential Moving Average (TRIX).
Therefore, we recommend that you give it a try and see whether it will help you get signals.
External Useful Resources
- Double Exponential Moving Average – Tradingview


