

It is easier to trade when the markets moves. But a good trader manages to make profits even in a trendless market. Traders use different tools and strategies to know when to enter or exit trades. The most common strategy is to combine fundamental analysis with technical analysis. The former is related to the news and data while the latter is about mathematical calculations.
In the past few months, we have looked at various indicators like moving averages, Bollinger Bands, Keltner Channel and the Relative Strength Index (RSI).
In this report, we will look at a relatively unknown indicator known as the choppiness index.
Table of Contents
What is the Choppiness Index?
As an active trader, you have likely heard about a choppy market. It is a term that is said many times in financial media like CNBC and Bloomberg. The term refers to a situation when the market is moving sideways or when it is trendless.
A choppy market is usually said to be boring because of how difficult it is to make money. Another thing is that a choppy market is that it is usually dangerous. Dangerous because of how difficult it is to predict where the price will move after.
The Choppiness index is a technical indicator that helps traders navigate choppy markets. It was developed by an Australian trader known as E.W Dreiss. He developed the indicator using the concept of fractal geometry to measure the price movements of a financial asset.
The indicator, which is not very popular, can be used in forex, commodities, and stocks. When applied in a chart, the indicator has a single line and two bands.
How it is Calculated
The Choppiness index, as stated above, uses the concepts of fractal geometry. This makes it a difficult indicator to calculate. Therefore, you don’t need to calculate the indicator if you are a trader.
Instead, you just need to know how to use and evaluate it. If you are into calculations, you should follow the following procedure:
| CI = 100 * LOG10(SUM(ATR(1), n) / ( MaxHi(n) – MinLo(n) ) ) / LOG10(n) |
Where:
- n = period
- Log10(n) = base – 10 LOG of n
- ATR (1) = Average True Range (period of 1)
- SUM(ATR(1), n) = Sum of the ATR over the past n bars.
- MaxHi (n) = The highest high over past n bars
Setting the Choppiness index
The overall setting of the Choppiness index is relatively simple. In most cases, you just need to change the period of the indicator. By default, most trading platforms have set this to 14 but you can tweak it to match your trading strategy.
You can also change the color of the Index line and the overbought and oversold bands.
How to Interpret the Choppiness Index
As mentioned above, the Choppiness index has a line and two levels. The range of the indicator is between 0 to 100. The higher side of the range means that the choppiness level. A level at or close to zero shows that the price of the financial asset is trending.
Example of the Choppiness
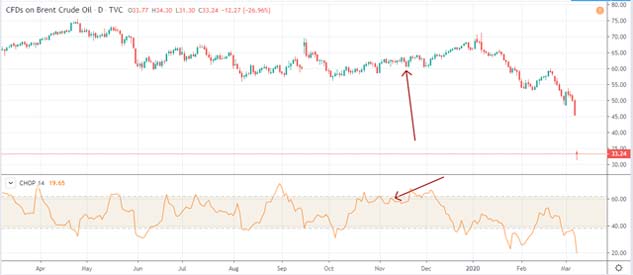
You can use the Choppiness index on its own. However, the indicator is usually used better by combining it with other technical indicators like moving averages and the RSI.
By combining it with other indicators, you will reduce the chances of false breakouts. As you can see below, the Choppiness index remained flat when the price of Brent crude oil was moving sideways. It then started declining as the price started moving downwards.
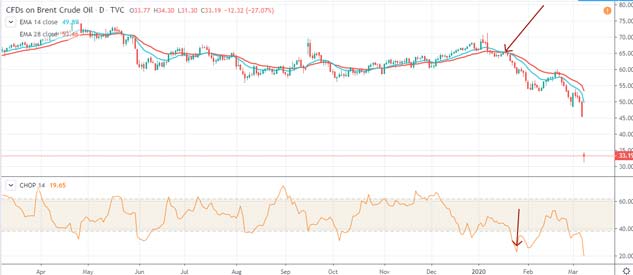
Another example is shown below. In this example, we can see that the Choppiness index moved below the lower line as the price of oil started trending downwards.
Is the Choppiness index worth it?
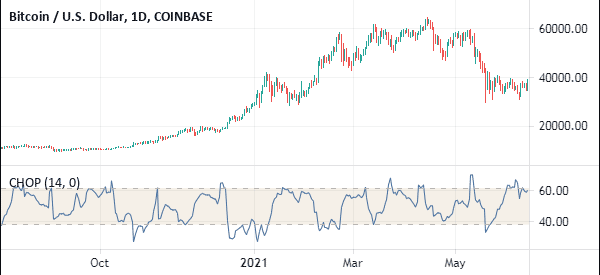
The Choppiness index is not an especially useful indicator. It is usually relatively difficult to find buying and selling signals. It also sends some difficult-to understand signals as shown in the Bitcoin chart below.
An intensive look at the indicator provides no entry and exit signals. Therefore, we recommend that traders should use it sparingly or use alternative indicators all together.
Final Thoughts
There are several ways of knowing whether the price of an asset is moving in a sideways direction. The most common method is to just look at the asset.
The choppiness index provides a data-backed process of telling when the price is either trending or ranging. As a trader, we recommend that you spend a considerable amount of time learning about the indicator. You should also practice with the indicator as much as possible.

