In the past few weeks, we have looked at a number of indicators. A common theme about most of the indicators we have covered is on the importance of the moving average. The average has been used to create other indicators like Bollinger Bands and Envelopes.
In this report, we will look at an indicator that was developed by using exponential moving averages. Maybe one of the best solutions to find divergencies and breakouts.
The Triple Exponential Average (TRIX), is an indicator that was developed by Jack Hutson. Jack was the editor of the Technical Analysis of Stocks and Commodities magazine. He developed the indicator in the late 1980s to combine oscillators and trend indicators.
Okay, enough talk. Let’s go over what this indicator is in practice and how to best use it.
Table of Contents
What is TRIX Indicator?
The TRIX is an indicator that shows the percentage range of change of a triple exponentially smoothed MA.
The indicator is available in most trading platforms. While it is not found in the MT4, it can be found freely in the MT5 platform. It can also be installed from the MQL marketplace. It can also be found in the Trading View platform.
The role of the indicator is to filter out insignificant movements in price as is the case with the MACD indicator.
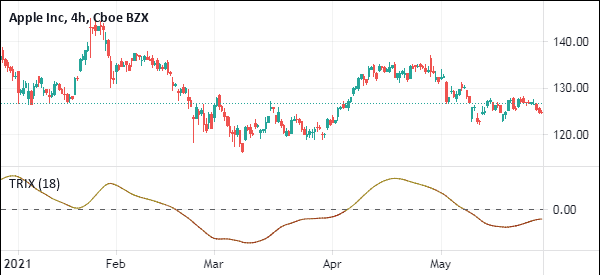
The chart below shows how the TRIX indicator looks like. In this example, we have applied it on Apple shares.
How do you calculate it?
As the name suggests, the TRIX indicator is calculated by first calculating the first exponential moving average. An exponential moving average is preferred because it places a lot of emphasis on the last closing price.
The first EMA is then smoothed. After this, a double smoothed exponential moving average is calculated and then smoothed. Finally, a triple-smoothed EMA is calculated.
After this, the TRIX is the 1-percent change of the triple smoothed EMA.
The most commonly-used period to calculate the Triple exponential moving average is 15. Still, you can use a number of your choice depending on your trading style.
TRIX is usually negative when the triple-smoothed EMA is falling and positive when the EMA is moving upwards.
How to Use the TRIX Indicator
There are various ways of using the TRIX indicator. First, you need to know how to set it up. There are two things that you can change when using the TRIX indicator. First, you can change the up and down colors. Second, you can change the period of the indicator. The default period in the indicator is 18 but you can change it to suit your trading preference.
One common method of using the TRIX indicator is to buy when it starts turning around when it is below the neutral line. The understanding is that the asset is usually oversold during this time.
TRIX trading strategies
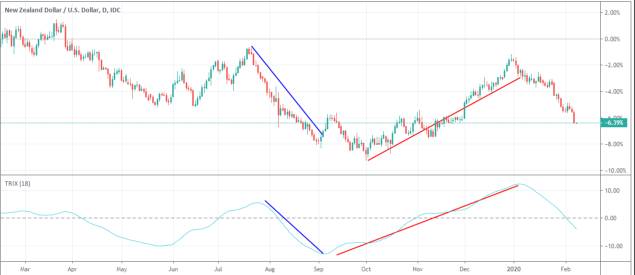
Similarly, you can sell or go short when the TRIX line starts moving lower. This is shown in the chart below.
The blue lines show when the TRIX indicator sends a sell signal while the red line shows when it signals a buy. When using this method, you should ensure that the price of the asset is either trending upwards or downwards.
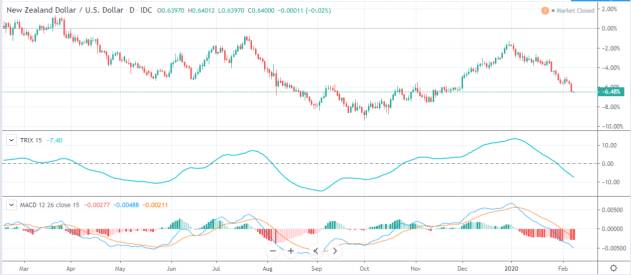
Another way of using the TRIX indicator is to combine it with the Moving Average Convergence and Divergence (MACD) indicator. This is because the two indicators appear to be almost the same.
Combining the two indicators helps you avoid a false breakout. A good example of when the two indicators are used together is shown on the chart below.
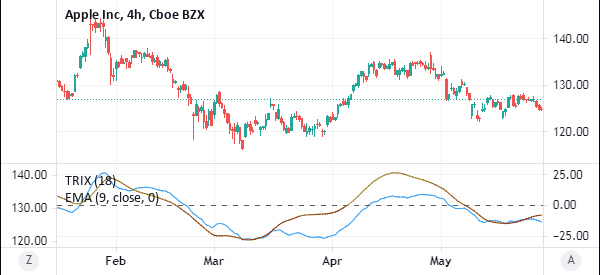
The next popular strategy of using the TRIX indicator is to overlay it with the exponential moving averages (EMA). To do this, you apply a 18-day TRIX and then apply a 9-day EMA.
The buy signals will typically come out when the TRIX and the EMA make a crossover while they are below the neutral line. At the same time, bearish signals will mostly come out when the crossover happens above the neutral line, as shown below.
Advantages of the TRIX
There are several benefits of using the TRIX indicator.
1 – It is found as a default indicator in most trading platforms. This means that you don’t need to buy or download it from the marketplace.
2 – The method of calculating the indicator is relatively simple. It is much simpler if you know how to calculate the exponential moving averages.
3 – As shown above, the method of applying the indicator is relatively easy compared to other indicators.
4 – The indicator can be applied on all asset classes.
5 – It is an ideal method of finding divergencies and breakouts.
→ Trading Breakouts: 3 Key Ways To Be Successful
Final Thoughts
The TRIX indicator is one of the easiest to use indicators. It has been in use for more than 30 years. It is also easy to calculate.
As a trader, we recommend that you take time to practice using the indicator. You should do this using a demo account for a few weeks to set various scenarios.
External Useful Resources
- Advantages of TRIX, Triple Exponential Average – Investopedia
- TRIX – Standard Momentum Oscillator or Something More? – Tradingsim


